Bar Graphs
Bar Graphs Construction:
- A graph of data that uses bars for data presentation is called a bar graph
- The bars are rectangles, usually longer than broader.
- The rectangular-shaped bars have varying heights but uniform widths.
- The height of a bar varies according to the numerical value of the data it represents.
Data Interpretation of the above Bar Graphs:
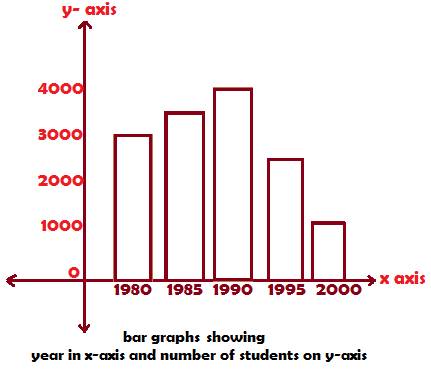
- The numbers on x-axis denote years increasing by five
- The numbers on y-axis denote number of students increasing uniformly by one thousand.
- The height of a bar is proportional to the enrolment strength
- The width of bars denoting years are uniform
- A cursory glance at the bars tells us that enrolment increased steadily from 1980 to 1990
- The enrolment decreased sharply from 1990 to 2000
The above bar graph can yield to further data interpretation through the questions below:
The concept of Estimating is required to find bar lengths or heights in bar graphs approximately.
An imaginary line should be drawn at the top of any required bar cutting across the y-axis. The point on y-axis at which the imaginary line is supposed to pass through is then taken as the approximate height of the bar.
1. What is the increase in enrolment from 1980 to 1985?
In the bar graphs above,
the 1980 bar rises upto 3000; the 1985 bar rises to midway between 3000 and 4000, so it is 3500.
Now the increase in student enrolment form 3000 to 3500 is
3500 – 3000 = 500
2. What is the approximate percent increase in enrolment from 1980 to 1985?
Answer:
The formula for percent increase is
(Increase/Initial value) × 100%
Increase from 1980 to 1985 is from 3500 to 3000, i.e. 500
So increase is 500; initial value, 3000, therefore
Percentage increase is
(500/3000) ×100% = (1/6) × 100% = 16.66%,
which rounded to the nearest integer is 17% approximately.
3. What is the ratio of enrolment of students in the first year to that of the last year?
Answer:
From the bar graphs above,
Enrolment in the
First year, i.e. 1980 is 3000, and in the
Last year, i.e. 2000 is 1000.
Hence, the ratio is 3000: 1000 = 3: 1
4. What fraction is lowest enrolment to the highest one?
Answer:
Highest enrolment is in the year 1990, and it is 4000, while
Lowest enrolment is in the year 2000, and it is 1000.
So fraction of lowest to highest enrolment is 1000/4000 = ¼


